
Likely, we’ve all dealt with the boss or client who only cares about seeing high-level results. He or she works an extremely busy day, juggling meetings, calls and emails, with minimal time for reading reports.
So, how do you determine what “big picture” stats to include in a report for this person? You don’t want to hand over a bunch of PDF screenshots from Google Analytics with endless columns and graphs that will only serve to confuse.
First, take the time to understand what’s important to the executive receiving your report. For the sake of this article, let’s say you’re talking to the CEO, but the tips and tactics hold true for any busy executive within your organization or a client’s.
Have a Meeting
Before you prepare your first analytics report, schedule a meeting with the CEO to determine what stats he or she considers most important. If you cannot get on their calendar, meet with a direct report who knows the CEO’s priorities.
Discuss the primary goals for the business, since those goals should ultimately translate into the goals you track in analytics.
Examples of business goals may include:
- Increasing revenue from an online store
- Filling up seats for events
- Signing customers onto ongoing service plans
Determine Top Level Metrics
After discussing business goals with the CEO, start thinking about what metrics you can pull from analytics to best track those goals. Remember that he or she will not want to review pages and pages of spreadsheets, so stick to a few top level metrics, and categorize them in a way that relates to the business objectives discussed in your meeting.
- How many people are coming to our site? Show the trend in number of users visiting the site.
- How are they finding us? Show the website’s top traffic sources.
- How many leads are we getting? Show completions and conversion rate for a goal that defines qualified leads.
- Where are they coming from? Show top geographic locations of users.
Build the Report
Once you have determined the metrics you want to include, get to work building the report. If you use a reporting platform like Megalytic, you can easily build a template that incorporates your key metrics. Make sure you keep the CEO’s high-level approach and limited time in mind when building the report, using the following guidelines.
Keep it Brief
Just because you can collect the information, doesn’t mean you need to show it. For example, don’t show a list of all 5,000 organic search keywords that brought people to the site over the past month. While you should be reviewing that data in depth for your own work, stick to the top 20 for your executive reader. This person trusts you to take care of the granular details, so do so and only present them with what they need to know. Stick to a report that, when printed out, remains under five pages.
Widgets from a tool like Megalytic allow you to display analytics data in a more concise, customizable format than you can get directly in Google Analytics. In addition, you can choose to show only the most important metrics to show your CEO.
For example, he or she may not care about understanding the nuances of bounce rate, average time on site, and other engagement statistics. However, Megalytic’s “engaged sessions” metric helps you see non-bounce sessions that spent a minimum specified amount of time on your site.
The “Engagement by Channel” widget helps show an overview of engaged sessions by Channel Groupings from Google Analytics.
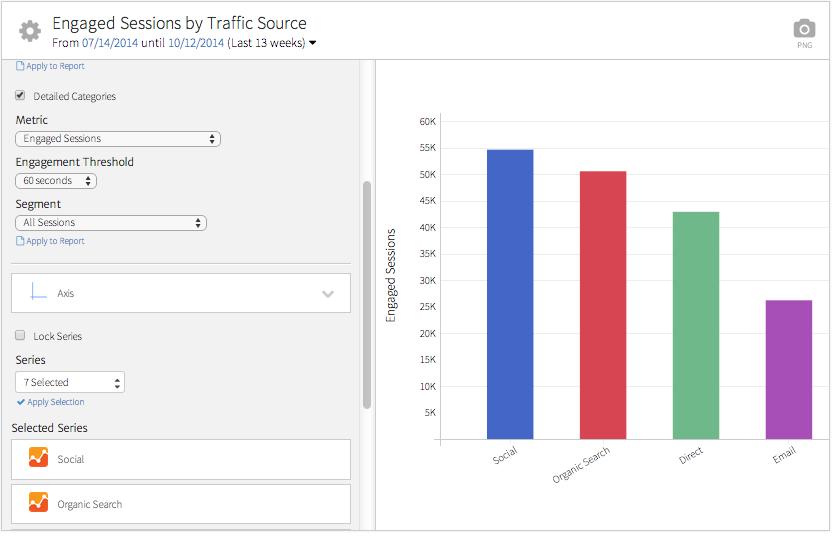
In this example, we’ve chosen to show “Engaged Sessions” for the metric and set the Engagement Threshold to 60 seconds, to count only non-bounce sessions over 60 seconds. We can then use this widget to show a high-level view of valuable users who spent significant time going through the site.
Use Visuals
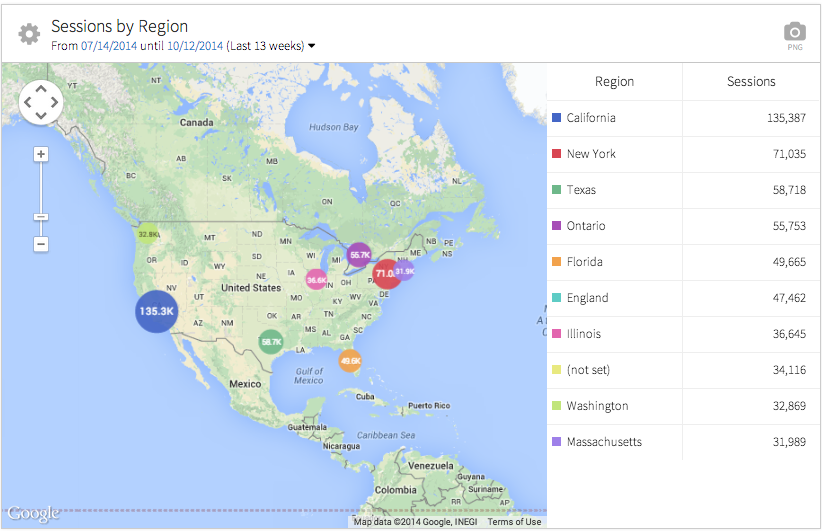
Visuals such as graphs and maps help to communicate the big picture, especially when someone does not want to pore over tables full of numbers. For instance, Megalytic’s Traffic by Geography widget lets you immediately see the top regions from which people are visiting your site.
In this example, you can see with a quick look that California and New York rank as the top states for traffic. From this data, the CEO can judge if the website is reaching enough people in the intended markets, as well as identify regions where the site’s marketing may need to be increased.
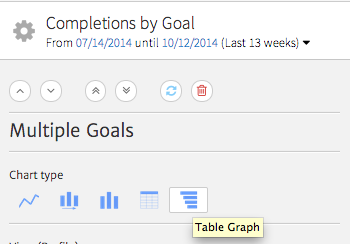
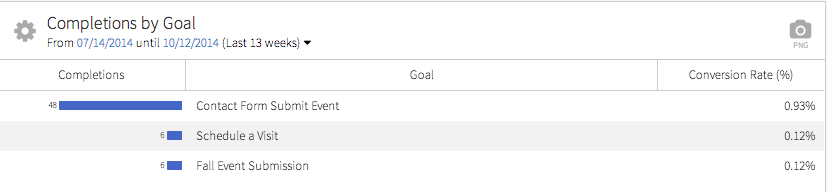
In addition, show simple graphs along with statistics such as volume of sessions and goal completions. In the example below, we’re using the “Multiple Goals” widget to show a simple breakdown of the major goals for this site, choosing to display a “Table Graph” along with the data.
Now, you can see the relative volume of goal completions by comparing the bars in the left hand column. In this example, we see that people are much more likely to reach out via a general Contact page than to utilize the Schedule a Visit form elsewhere on the site.
Explain Metrics
While you don’t need to include pages of explanatory text for a busy CEO, you should take the time to include short descriptions of key metrics that may be unfamiliar. In addition, call out key insights, and explain how the data relates directly to business goals. For example, don’t just show a list of conversions. Explain how the conversions represent leads, newsletter signups, event registrations, etc., which fit into the marketing funnel to ultimately contribute to revenue.
In Megalytic, you can easily add a Notes widget to include commentary in relevant places throughout a report. This is incredibly helpful for providing the context behind the numbers.
Conclusion
When preparing a report for a “big picture” executive such as a CEO, make sure you start by understanding the top-level company goals and how those are measured by web analytics metrics. Determine the bare minimum set of metrics you can report that measure the website’s contributions to achieving those goals. Finally, assemble those metrics into a concise report including charts and graphs with short text explanations that the CEO can read quickly to determine if the website is meeting the company’s objectives.

