Watch the Video
The video below demonstrates how to create the report discussed in this post. Watch it to get a quick overview before reading the rest of this post.
https://www.youtube.com/watch?v=85OatGsiNP8&feature=youtu.be
Monthly Revenue
A good chart to lead off your report is a monthly revenue bar chart. This basic chart provides context for the remainder of the report, and answers the all-important question – is revenue increasing or decreasing?
Use the “Metric Timeline” widget to create this chart, and select the “Revenue” metric from the series selector as shown below.
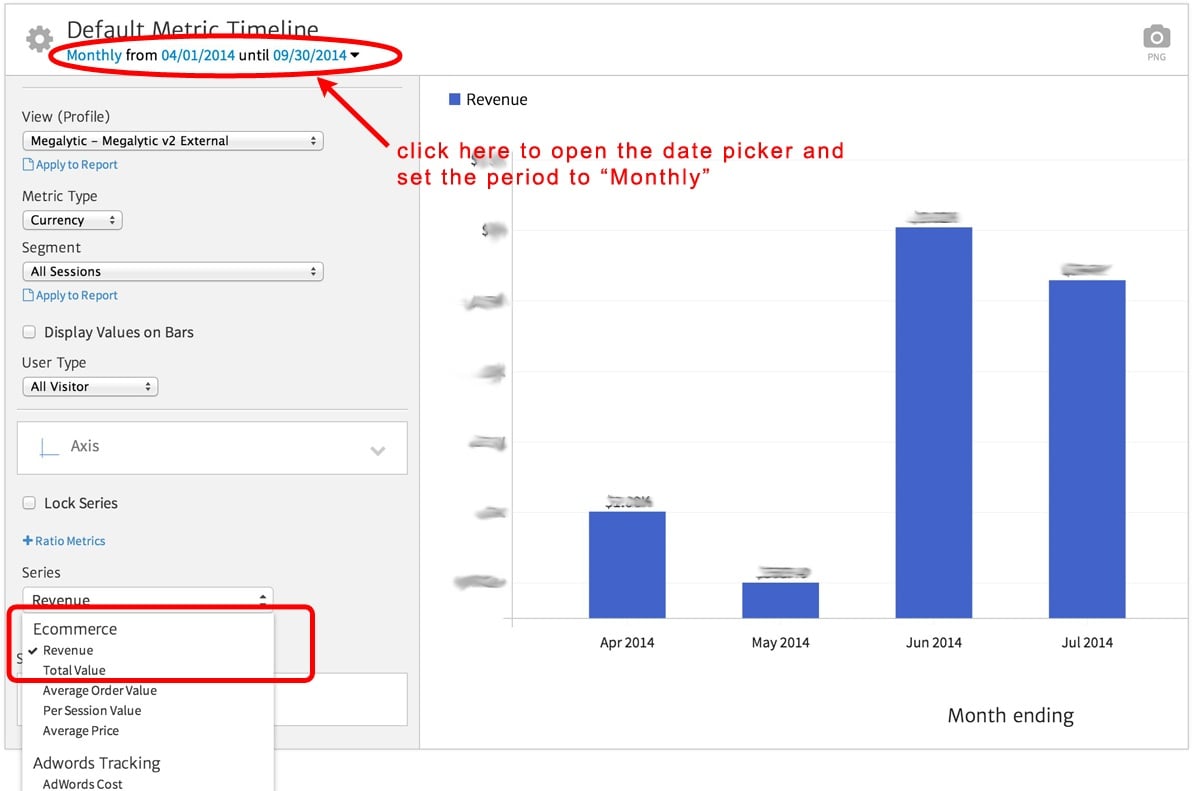
Use the date picker to set the time period to “Monthly” and you are done! You’ve created a basic bar chart showing monthly Ecommerce revenue.
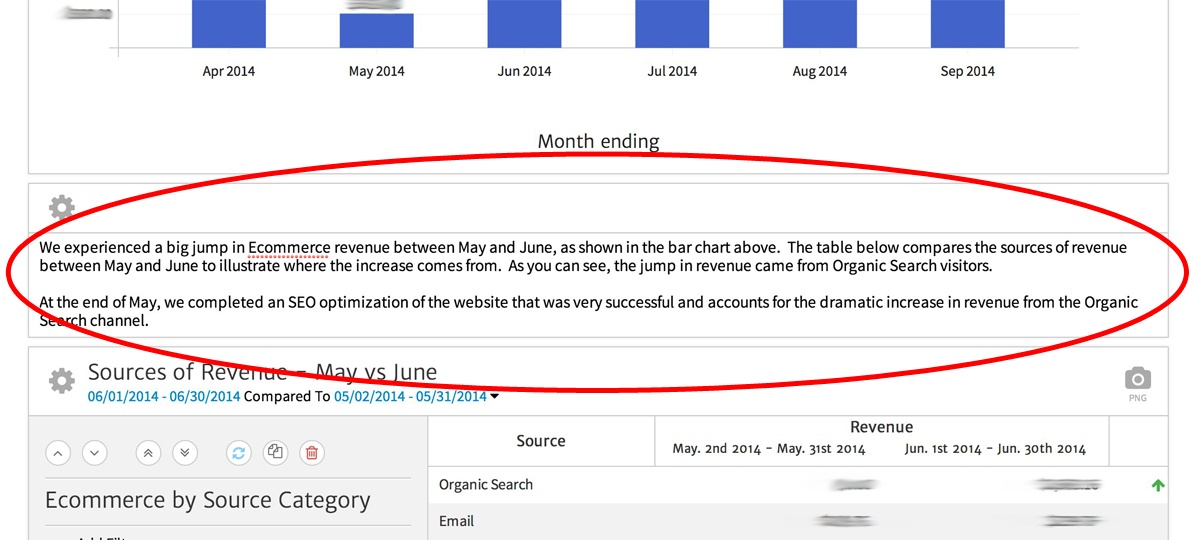
Looking at this chart immediately raises the question, “What happened in June?” We see there was a big jump from the April/May revenue levels to the June/July levels.
Good analytics report involves anticipating the reader’s questions and providing data and insights to answer them. To help us do that, next we will look at widgets that can be used to break down the revenue jump from May to June to identify the drivers.
Any subsequent charts we add to the report should provide insight into that question.
Sources of Revenue
To identify the source of the jump in revenue from May to June, use the “Ecommerce by Source Category” widget. This widget breaks down revenue by marketing acquisition channel: Organic Search, Paid Search, Referral, Email, Direct, etc.
Select the table chart type, and use the date picker to compare May with June.
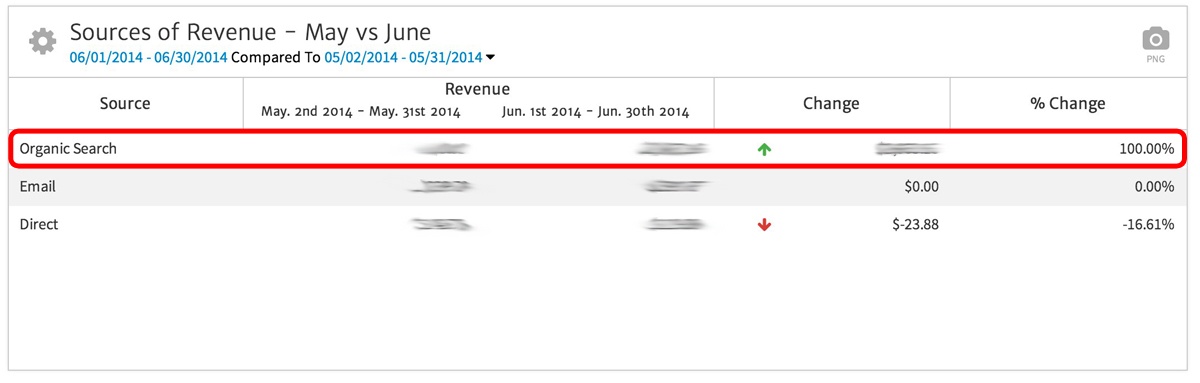
Here, we can see the Organic Search channel experienced a 100% increase in revenue from May to June, while Email was flat and Direct dropped by 16%. We also know at the end of May, a search engine optimization (SEO) campaign was undertaken to improve the organic search visibility of this web site. The chart above shows the SEO effort paid off.
Annotating the Report with Notes
Not every insight you wish to communicate within your Ecommerce Report can be conveyed via a chart or table. Sometimes, as in the case of the SEO campaign information, you want to include notes in the report that provide background and explain the data being presented.
Use the Megalytic Notes widget to add text to the report. As shown below, we can simply drag a Notes widget between the two just created.
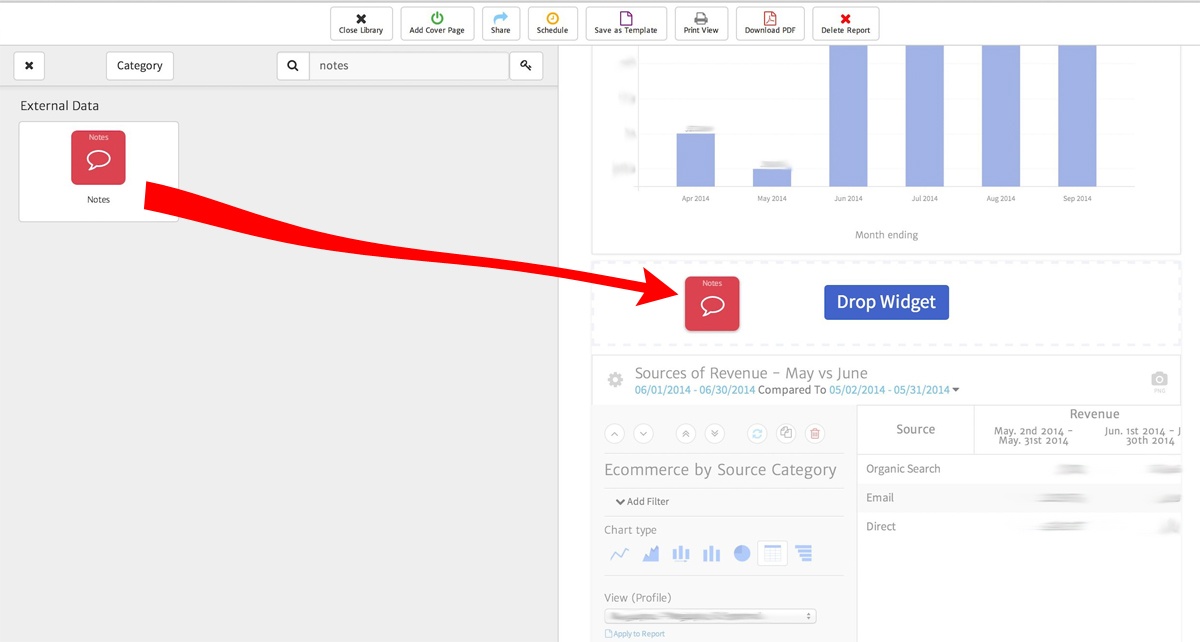
Once the Notes widget is placed in the report, we can edit the text to describe what the chart and table are showing. Here’s the finished note as it appears in the report.
Regional Ecommerce Results
Marketing campaigns often vary across geographies, so it makes sense to report Ecommerce results by region, as well. This enables you to determine the regions where demand for your product or service is strongest and compare against the marketing efforts for those regions. Areas that lag may indicate a need for changes in local marketing, while areas that generate the most revenue may be using marketing campaigns that can be copied in other geographies.
Megalytic provides the “Ecommerce by Geography” widget for this type of reporting. Below, you can see the map version of this widget, showing the top 10 revenue-producing regions around the world.
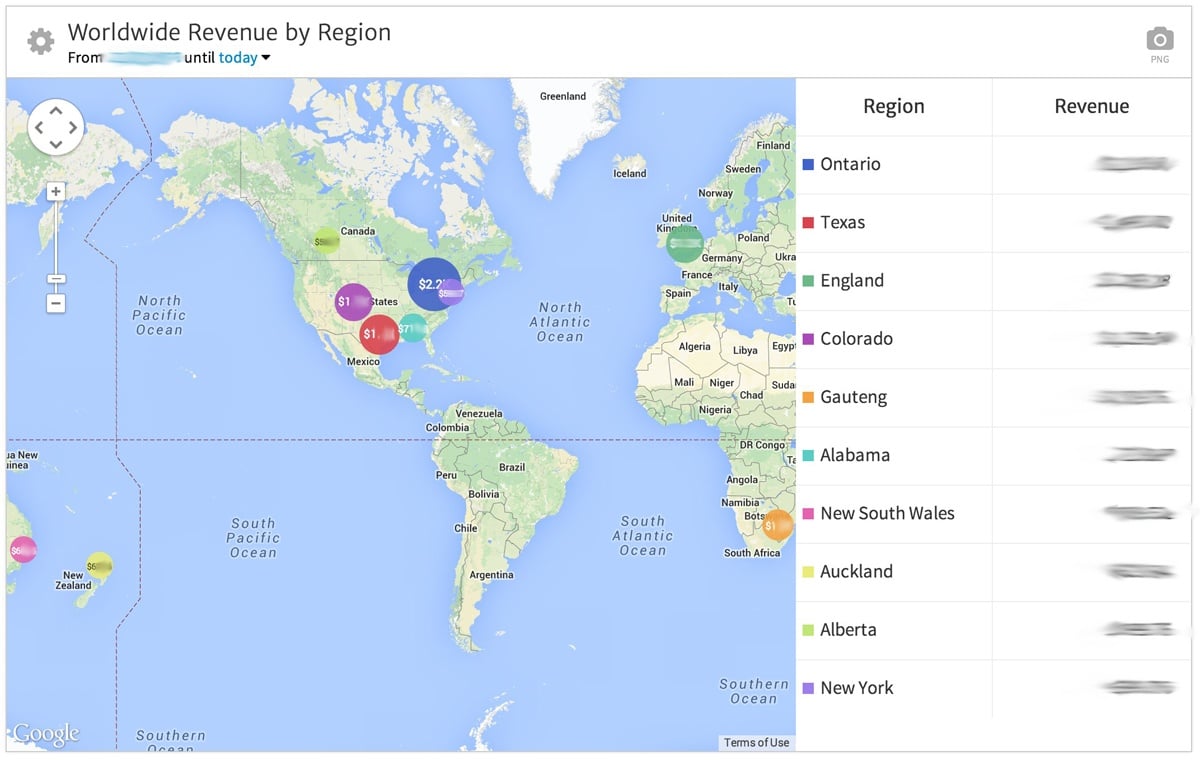
This widget can easily be customized, using the widget editor, to zero in on a particular country or city.
Demographics and Ecommerce
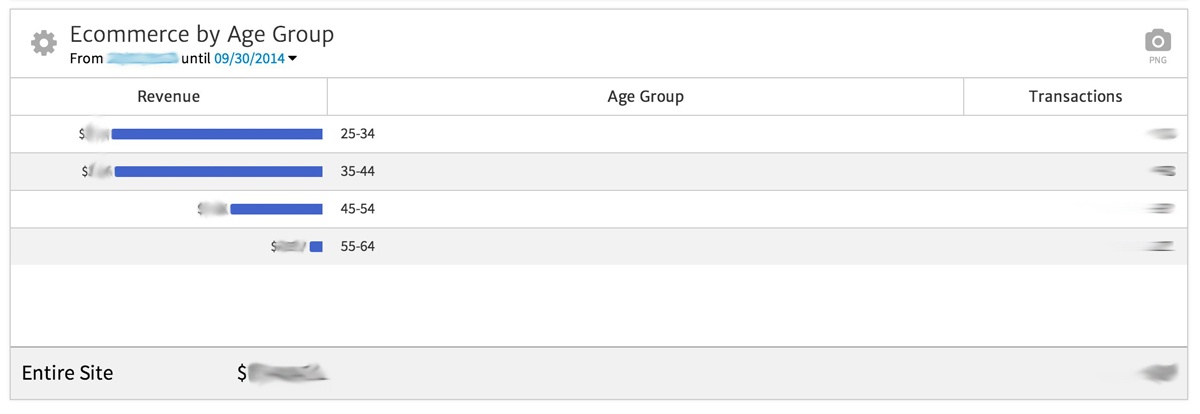
If you have enabled demographics tracking in Google Analytics, then you can use the Megalytic “Ecommerce by Demographics” widget to segment revenue by age group, gender and interests.
It is useful to know your audience and, in particular, the audience buying the most from you. Include a breakdown of Ecommerce by demographics in your report so your marketing colleagues can see if the revenue results line up with their expectations of the company’s target buyers.
As shown below, the default presentation of this widget shows revenue and transactions by age group. Using the widget editor, you can display other metrics such as conversion rate and average order value.
Other Ecommerce Widgets
In addition to the examples shown above, Megalytic provides a number of Ecommerce widgets to slice up your revenue data along a variety of dimensions. To see all the available Ecommerce widgets, open the widget library and enter “ecommerce” in the search field, as shown below.
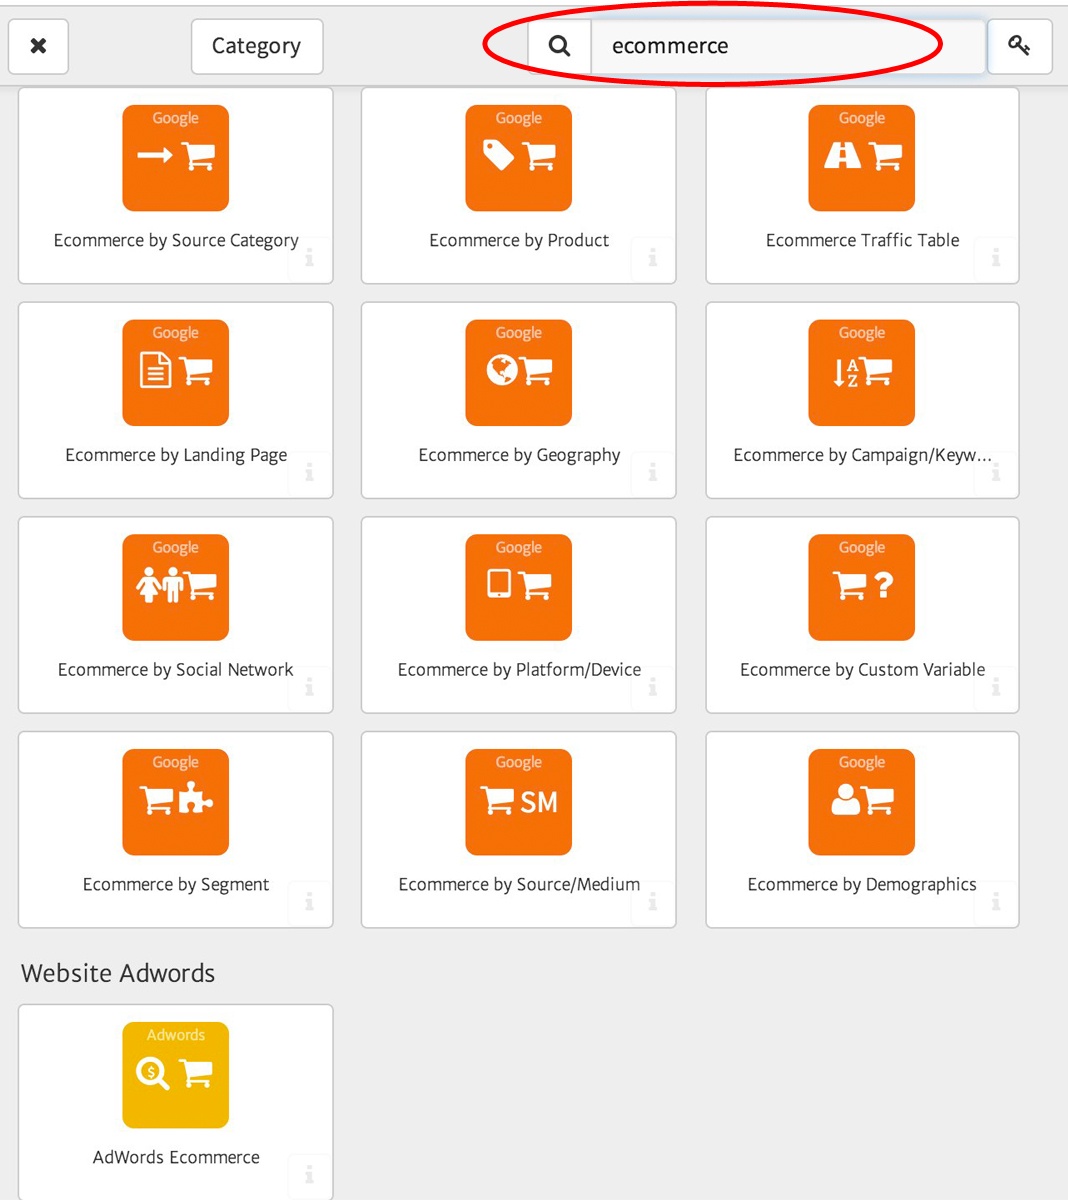
Here Megalytic provides widgets to analyze Ecommerce revenue by Source Category (marketing channel), Product, Landing Page, Geography, Campaign, Keyword, Social Network, Platform/Device (mobile, tablet, etc), Custom Variable, Segment, Source/Medium and Demographics.
There is also an AdWords Ecommerce widget that enables you to combine AdWords data with the revenue tracking available in Google Analytics.
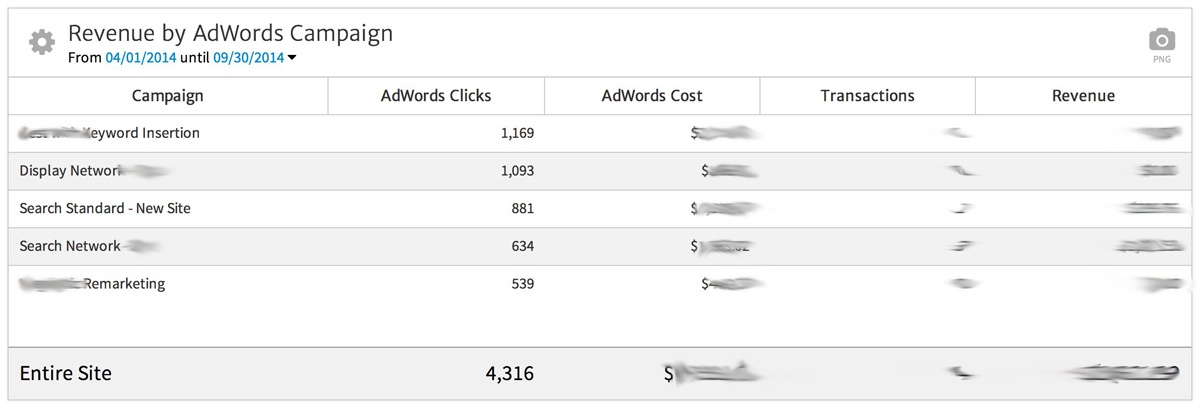
In this table, you can see – at a glance – which campaigns are producing the most revenue, how much was spent on those campaigns, the clicks generated and the number of transactions.
By default, this widget shows the Revenue by AdWords campaign, but it can be edited to show revenue by Keyword, Ad Group, or Ad Content. The default columns can be adjusted, as well, to show other metrics such as Cost per Click (CPC) or Return on AdWords Spend (ROAS).
Conclusion
Megalytic provides a powerful set of widgets that enable you to create Ecommerce reports that show high-level trends and drill down into the campaigns, geographies, demographics, and other factors driving revenue. In addition to providing readers with the data they need, take advantage of the Megalytic Notes widget to annotate your report with text that explains the data and highlights important insights.

