Create a Blank Report and Open the Widget Library
To get started creating your Ecommerce report, simply click on “Create a New Report” on the left side of your dashboard.
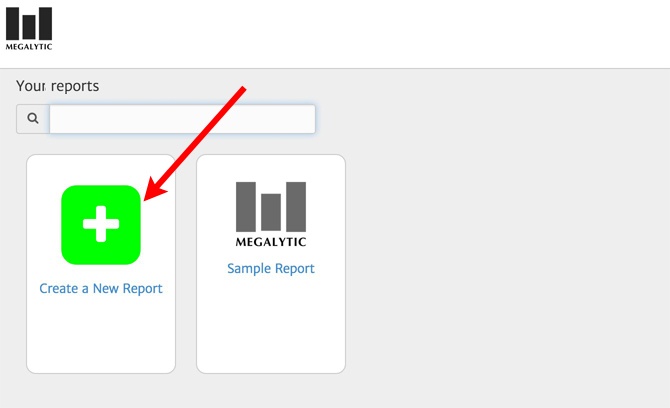
Select “Blank Report” as the template to start with a fresh canvas and begin building your report from scratch. This will also open the widget library in the left hand side of your browser. In Megalytic, reports are created by dragging widgets from the library on the left into the report canvas on the right.
If you would like to follow along by creating your own report, you can open a free Megalytic trial account - no credit card is required.
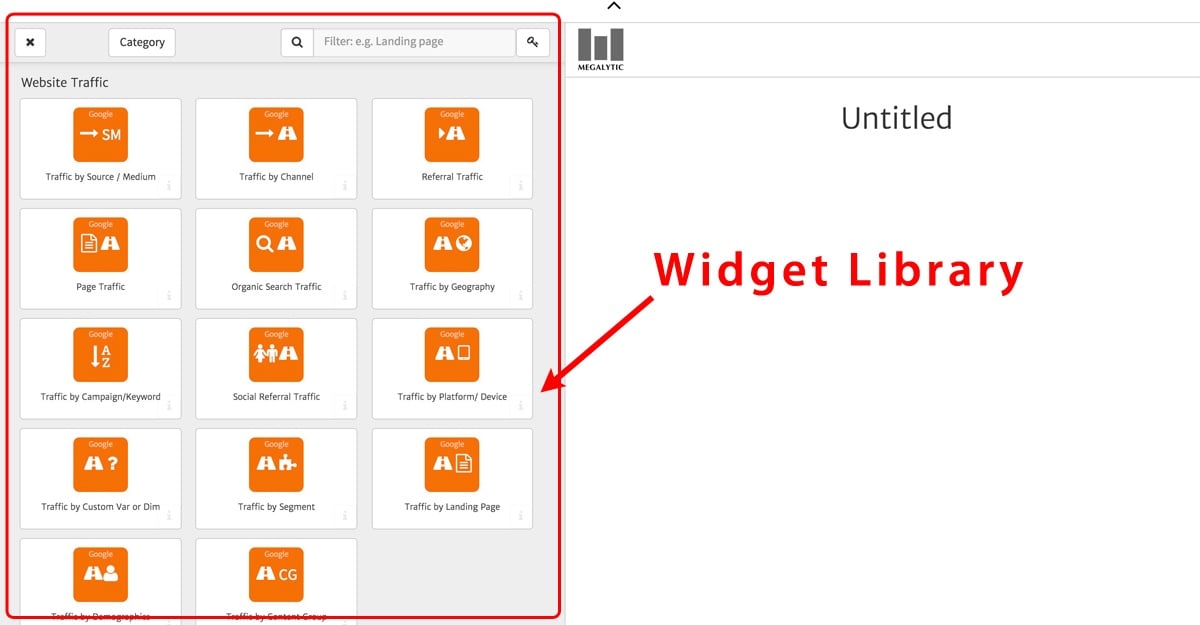
Megalytic offers a variety of widgets to help digital agencies, marketers and business owners with reporting. To show only Ecommerce widgets, we can search for “ecommerce” in the search bar in the upper right corner of the widget library.
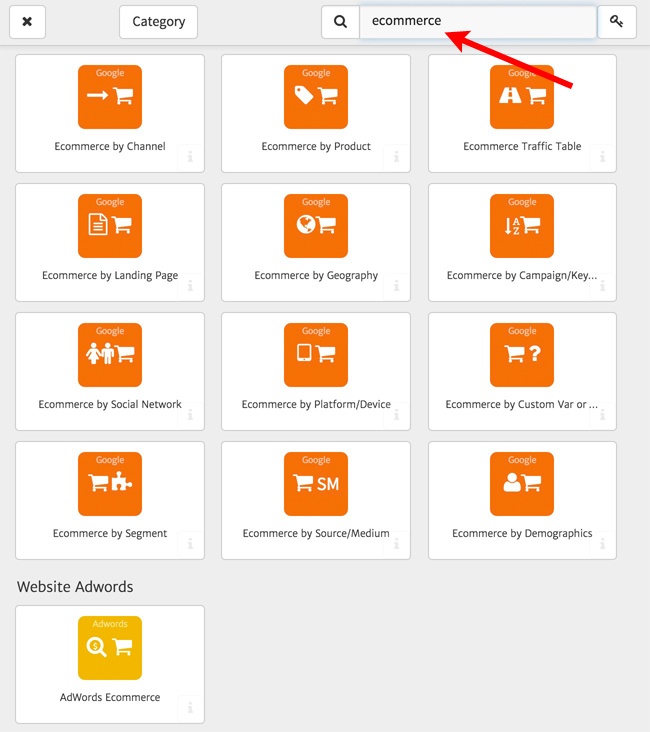
At present, Megalytic provides 13 Ecommerce widgets. Twelve (represented by orange icons) are related to Google Analytics dimensions like Channel, Product, Landing Page, etc. One (the yellow icon) is focused on Ecommerce resulting from AdWords campaigns.
What’s Driving Ecommerce?
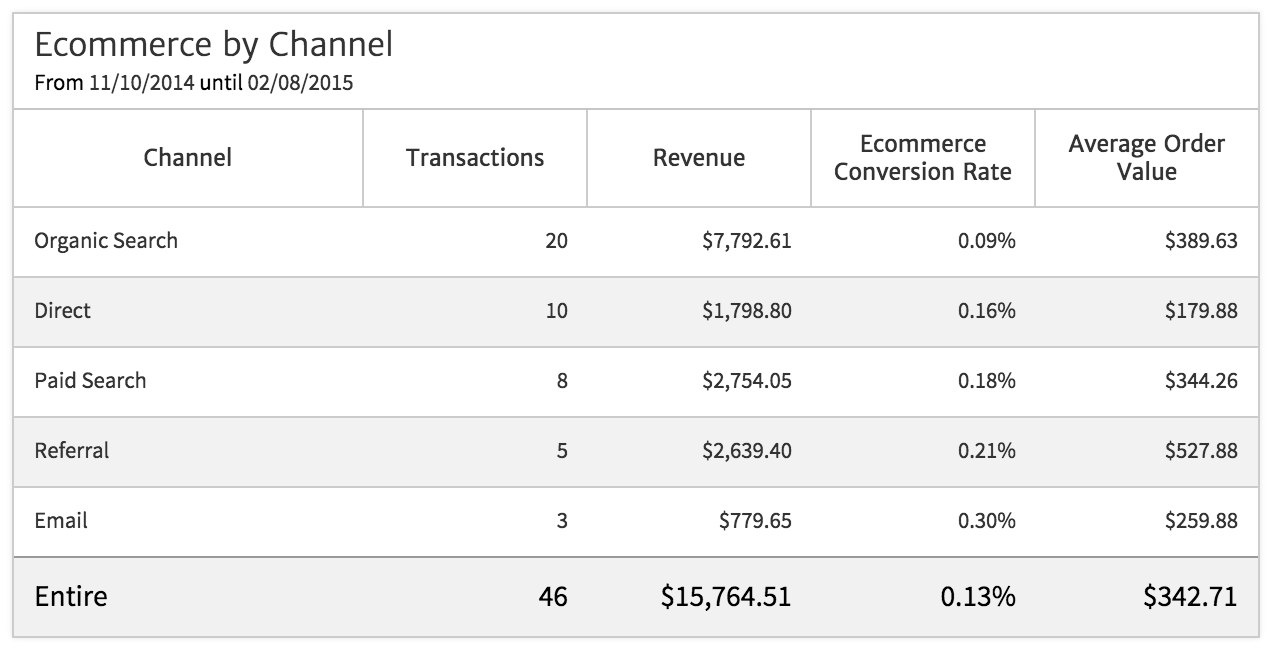
One of the important questions to answer in an Ecommerce report is to understand what acquisition channels drive revenue. Does traffic from paid search contribute more than referral traffic – or vice versa?
The Ecommerce by Channel widget shows the traffic sources that resulted in online purchases. In the example below, this widget shows that Organic Search provides the most transactions and revenue, while referral traffic has a higher Average Order Value ($527.88 vs $389.63).
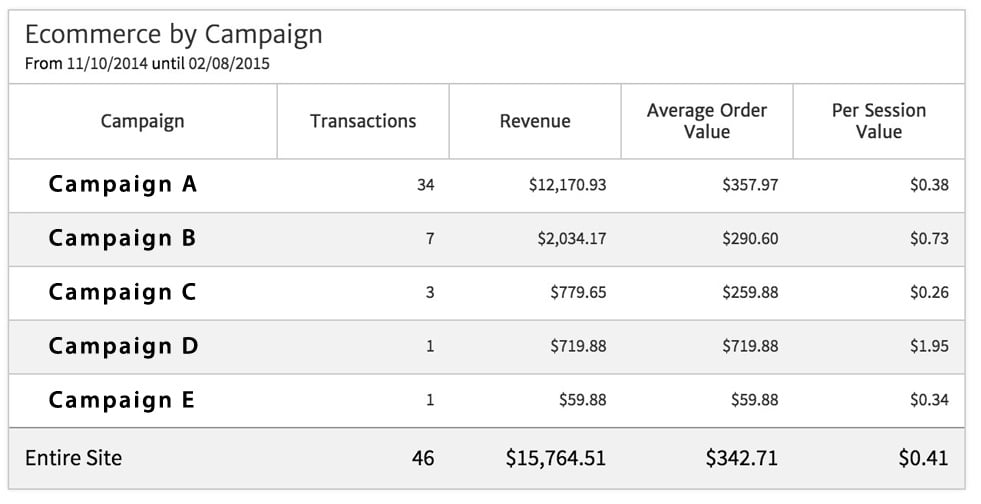
In addition to looking at revenue by acquisition channel, it is important to look at which campaigns are driving the most revenue. If you are tagging campaigns to track them in Google Analytics, you can use the Ecommerce by Campaign/Keyword widget to identify the campaigns producing the most revenue.
Here, you can see that Campaign A produces by far the most revenue. Interestingly, Campaign B, which produces the second highest number of transactions, has a much higher Per Session Value. The Per Session Value metric can be used to estimate the value of the traffic from a particular campaign. In this case, it tells us the average Session from Campaign B produced $0.73 in revenue, while the average Session from Campaign A produced $0.38 in revenue.
For this we can conclude that Campaign B generates more valuable traffic and that it may be worth shifting some resources from Campaign A to Campaign B. Of course, that judgment depends on the cost of Campaign B, as well. In general, you should aim to spend less per Session for traffic from each campaign than you receive in revenue (the Per Session Value).
Insight into Geography
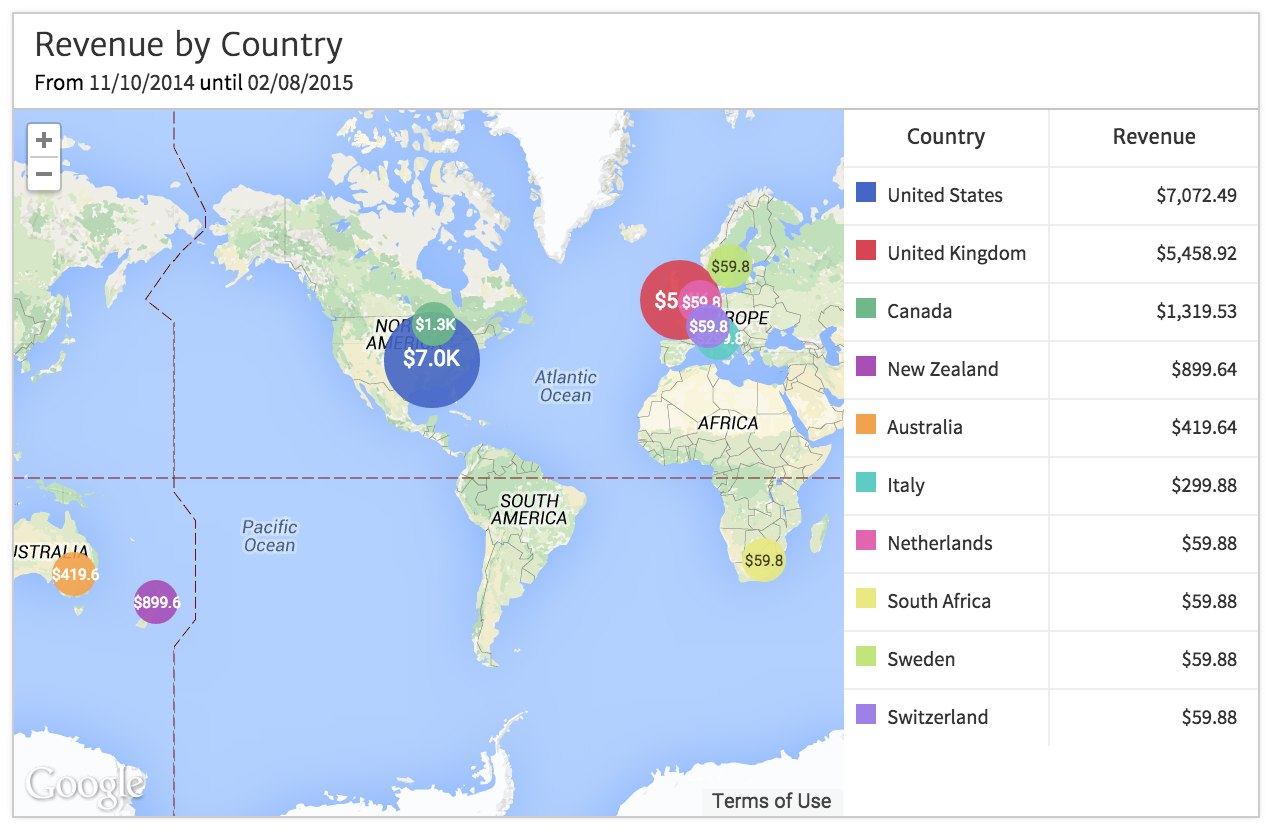
In addition to understanding what acquisition channels and campaigns are driving Ecommerce, it is often helpful to have a look at the geographic distribution of transactions and revenue.
Megalytic’s Ecommerce by Geography widget enables you to report on both revenue and transactions at a range of geographic levels from Country, to Region, to City. The example below shows Revenue broken out by the Top 10 countries.
Like all Megalytic widgets, the Ecommerce by Geography widget can be customized. For example, if you want to look at transactions instead of revenue, click on the gear icon in the upper left corner to open the Widget Editor. Then select “Transactions” from the Metric selector.
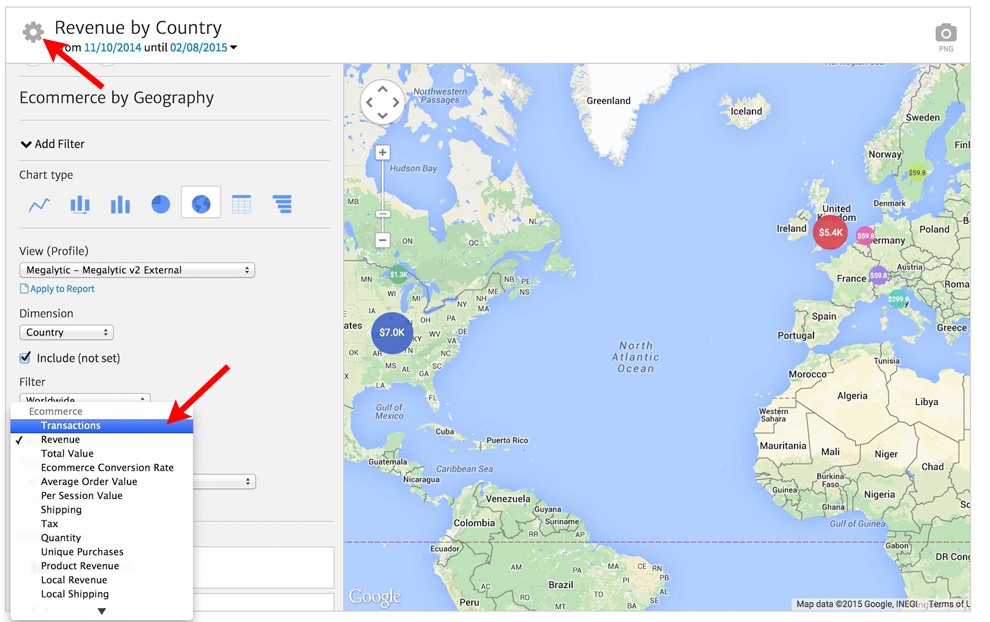
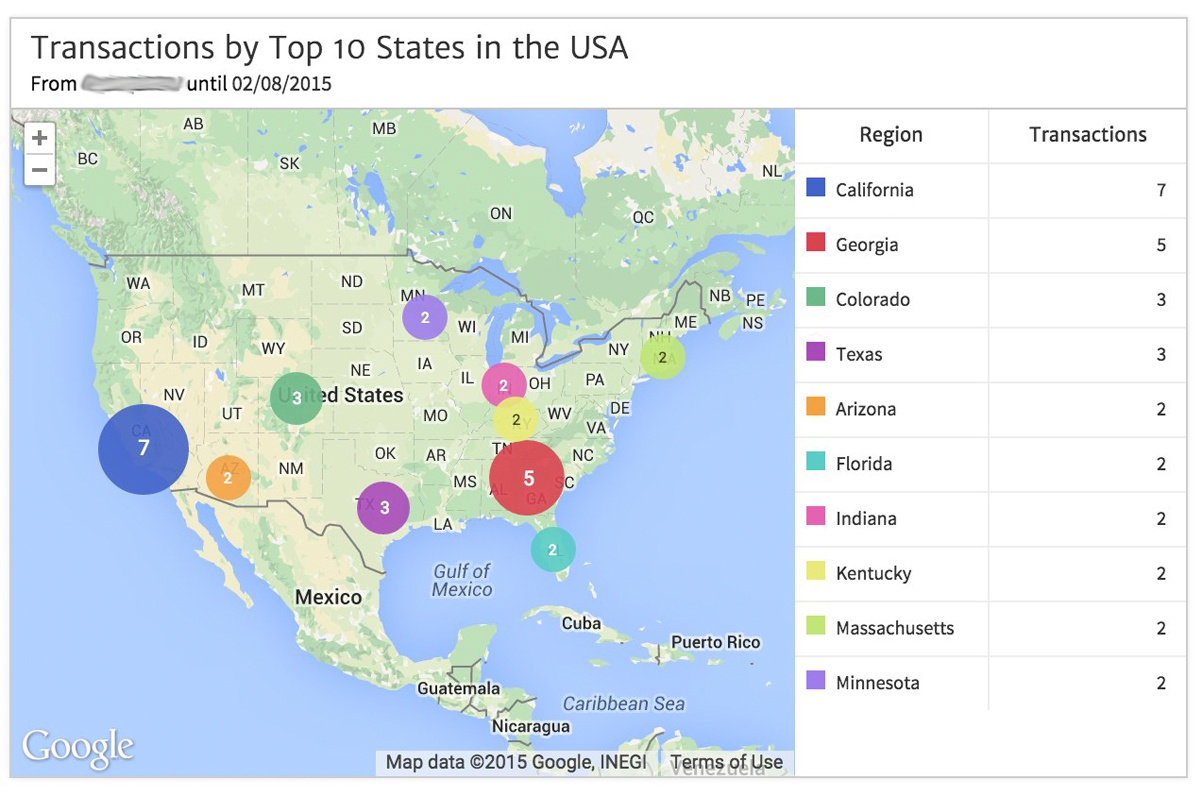
You can customize the widget further to focus on a specific geographic region. For example, if you wanted to look at the top states in the USA, you would select “Region” from the Dimension selector, and then United States from the Filter.
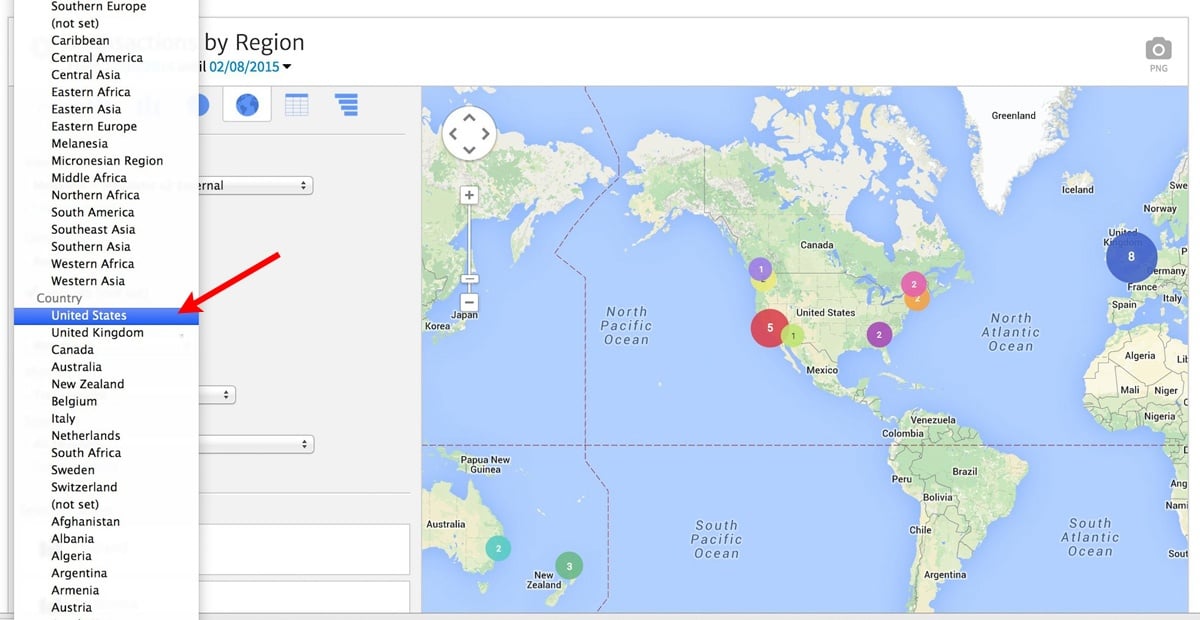
The resulting chart now provides a snapshot of transactions, rather than revenue, and is focused in on the United States.
Maps can be a great way to visualize data, but sometimes your audience will want to see other representations of geographic data, such as tables or bar charts showing the top producing locations. Megalytic widgets are flexible and enable you to easily change the way that you present data – from map, to table, to line, bar, and even pie charts.
Multiple Ways to Represent Data
The map above showing the Top 10 states is useful, but suppose that you want to provide your audience with a full list of the states contributing to Ecommerce revenue? And suppose you want to include more that one metric – maybe looking at Revenue, Transactions and Average Order Value across all states?
In that case, you would want to transform the geographic representation from a map into a table. To do that, again, click on the gear in the upper left corner to open the widget editor. Then click on the Table chart type.

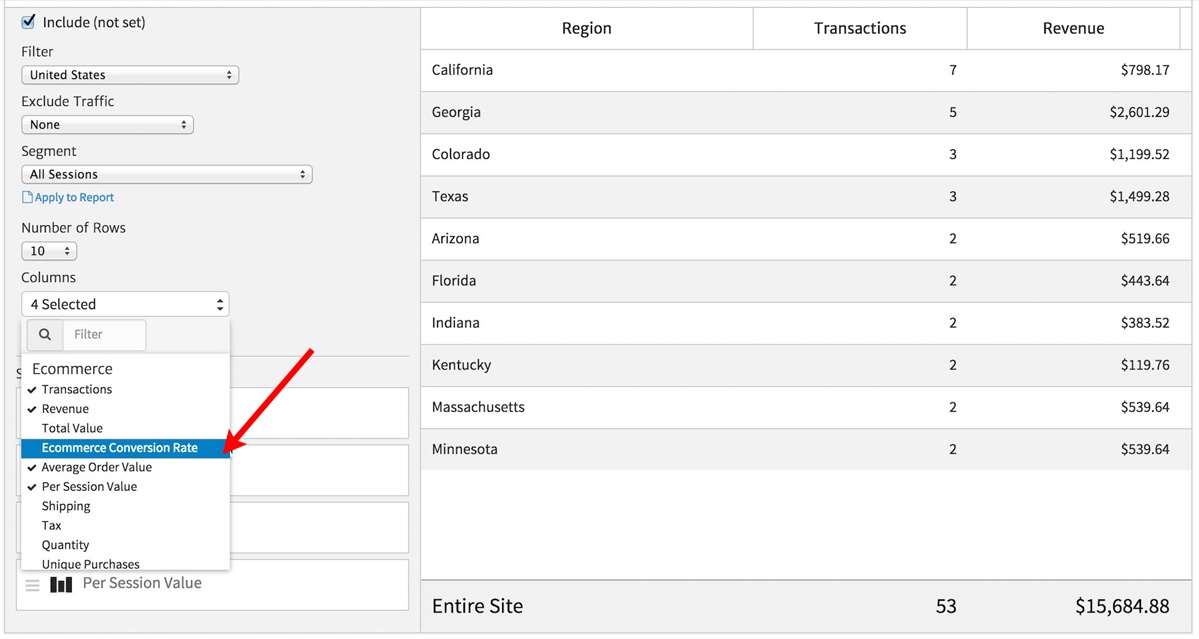
This will transform the representation of the data from a map format to a table format. In the table format, you have room for up to five columns for Ecommerce metrics. In this example, we are showing the default columns: Transactions, Revenue, Average Order Value and Per Session Value.

If you need to make changes to these default columns, from the Widget Editor you can select the Ecommerce metrics you want to include and deselect the ones you want to remove. For example, suppose that you want to show the Ecommerce Conversion Rate in your tables to highlight states that convert to paying customers at the highest rate. In that case, you would open the Widget Editor and select the “Ecommerce Conversion Rate” metrics from the “Columns” selector.
Conclusion
The beauty of Megalytic is that, once you have set up your Ecommerce report, you can easily update it each month to show the latest results. That will enable you to produce your report in minutes, rather than hours. To finish it off with some custom commentary, consider adding a Cover Page to summarize, or individual Notes among the widgets with text to explain the numbers and relate the data to specific business objectives.

