
Business to Consumer
As a sales leader at a B2C company, our salesperson manages a team responsible for increasing sales on an ecommerce site. As such, she is mostly interested in overall revenue (and seeing it continually increase), but she probably also cares about breaking down revenue by specific product lines. She would benefit from seeing how customers get to the site and what channels are contributing to the most sales.
For this B2C-focused sales leader, your report should concentrate on showing how each metric relates to business goals. A basic breakdown of the top traffic sources and engagement for each will help to provide a big picture of both successful channels and problematic areas.
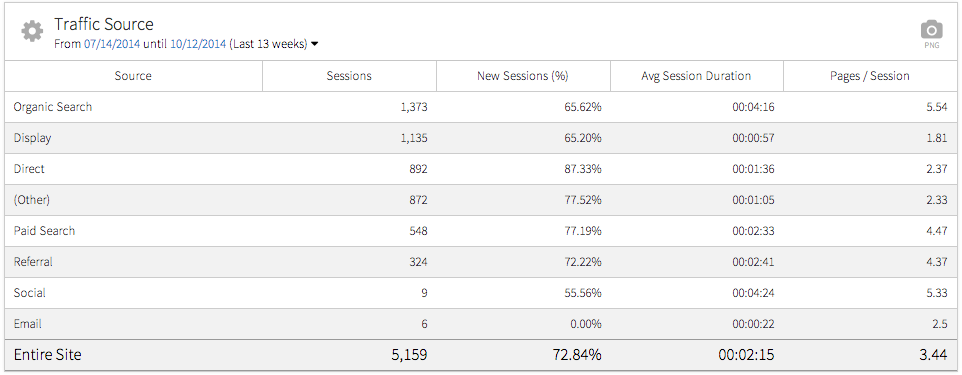
The Traffic by Source Category widget shows a broad overview of the best performing marketing channels without getting too complex, using Google Analytics’ broad “channel” categories. Of course, there are many ways to customize the data, but in this case we’ve selected a table showing a breakdown of sessions from various channels as well as some basic engagement statistics, including pages/session and average session duration.
While sales people may ultimately care about revenue, showing engagement on the site can tie into revenue generation, as the most engaged visitors often will be the most valuable.
In this example, we can see organic search drives the majority of traffic, with display advertising close behind. However, we can also note some lower traffic sources drive more engaged traffic. For example, social media contributed to only 9 sessions, but those sessions involved more time on site and more pages per session than any other channel apart from organic search. From this data, the sales team should get to work encouraging more involvement in social media.
In addition to looking at traffic and engagement, your report should break out the ecommerce results that track website sales. You do need to ensure that your website includes functional ecommerce tracking. See this article for advice on setting up ecommerce tracking with Universal Analytics.
Once you ensure ecommerce tracking is in place, present the data to the sales professional to guide her in understanding how online channels contribute to driving sales. She can then see how well email, organic search, paid advertising, and other channels converted into revenue.
Within Megalytic, the Ecommerce by Source Category widget shows a graph of the top channels that contributed to transactions over time. Using this widget will help identify both long-term trends for purchase behavior as well as which channels have worked best over time to drive sales.
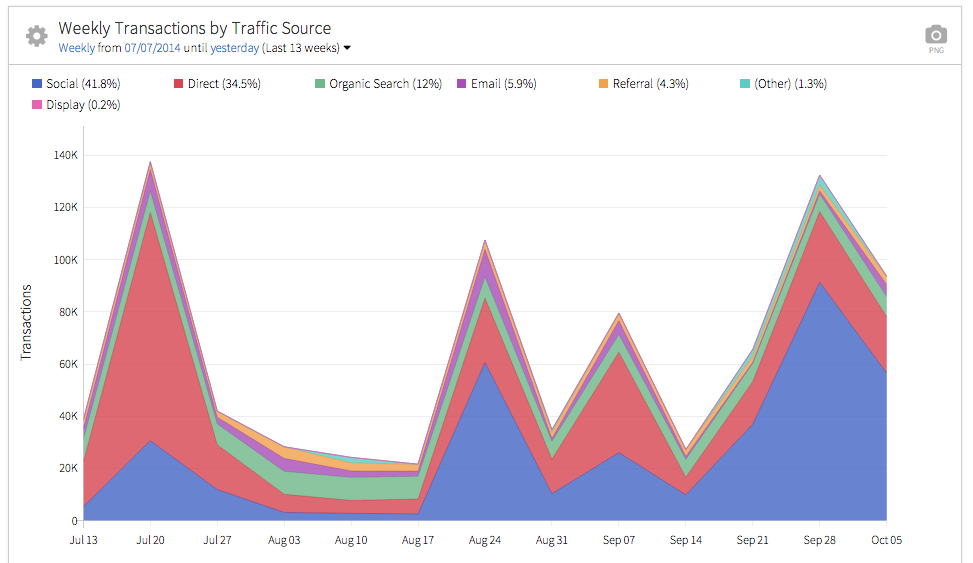
Using this widget, we can identify spikes in traffic around heavy promotion days, when this company sent out emails and ran promotional display campaigns. We can also pinpoint the best performing days and weeks over time. If this salesperson is responsible for future upselling or account renewal, she can go back and review what email content and social posts performed best to aid in planning future strategies. By being able to identify what worked or did not work in this past, a salesperson is better informed to sell future services (and had some weight to make the case!).
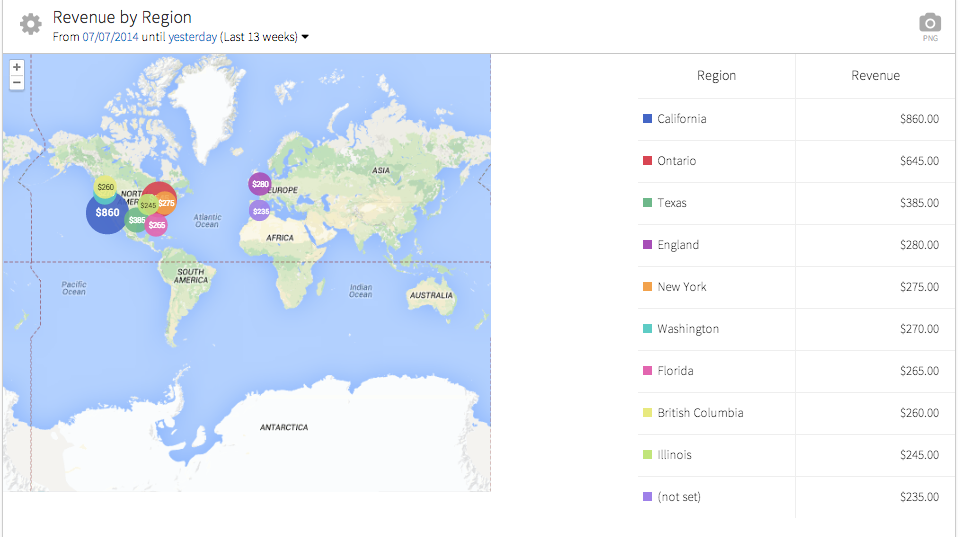
The Ecommerce by Geography widget will also prove helpful in allocating budgets and time to specific geographic areas based on performance. First, seeing how much revenue came from each area should drive decisions to focus more heavily on promotion in regions that bring more revenue. For example, if running AdWords campaigns, you can allocate more spend to campaigns targeting the most valuable regions. Next, if you have concerns about reaching additional areas, you can identify regions where you should be either investing more heavily in advertising or tweaking messaging to better suit the target audiences in those regions.
Business to Business
Now, let’s consider a B2B scenario. Working for a software company, our sales leader establishes relationships with prospects via phone, email, and in-person contact. He introduces the product via a demo, with the ultimate intent of prospects purchasing the software. In addition to offering a demo, he also promotes an email newsletter, which provides updates on product features, as well as giving valuable informational content relevant to prospects’ industries.
In this model, we want to identify the stages of conversion and help him see how the website contributes to every level of the funnel. We may use some of the ecommerce stats shown previously, but we also want to show how many people sign up for a trial or participate in a demo, identifying how these people first made contact with the site.
First, use the Conversions by Source/Medium widget to determine where trial account signups are coming from. When you add the widget, it will show all goals by default.
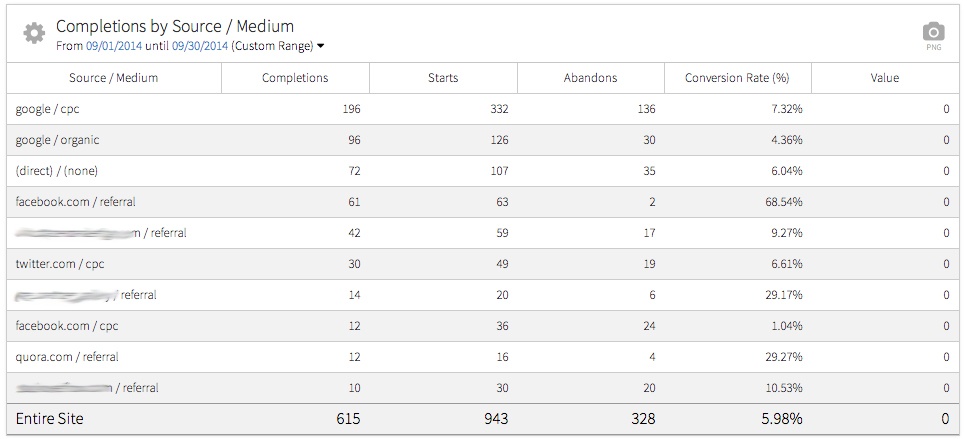
Once you’ve added the widget to the report, customize it to show statistics for a specific goal. Click the gear symbol in the upper left of the widget and make your choice from the Goal dropdown.
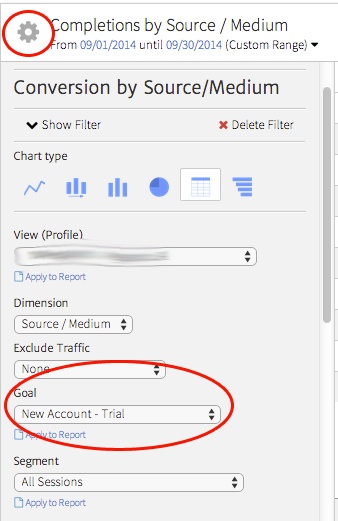
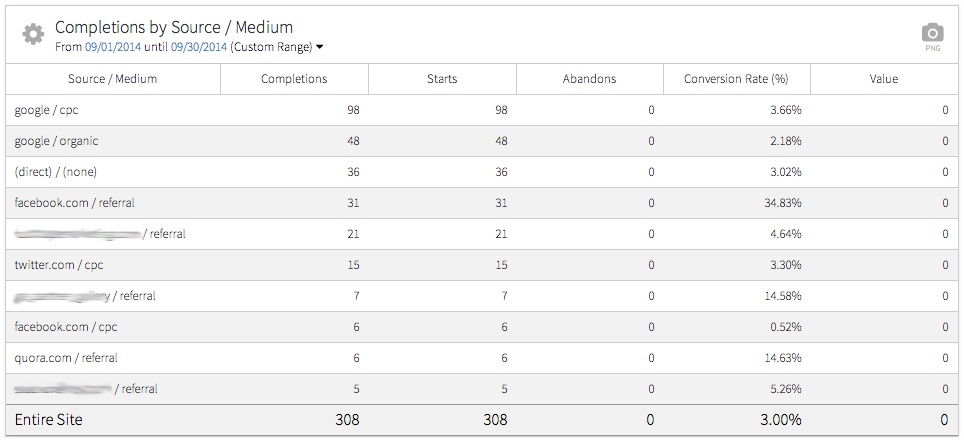
In this example, we see the final result after selecting a specific goal for the widget. We can see that paid and organic Google search drive the highest volume of conversions, but Facebook shows an exceptionally high conversion rate.
As the next step in the funnel, we want to look at how well trial accounts convert into signups for actual paid accounts over time. To do this, we’ll use the Goal Conversion widget.
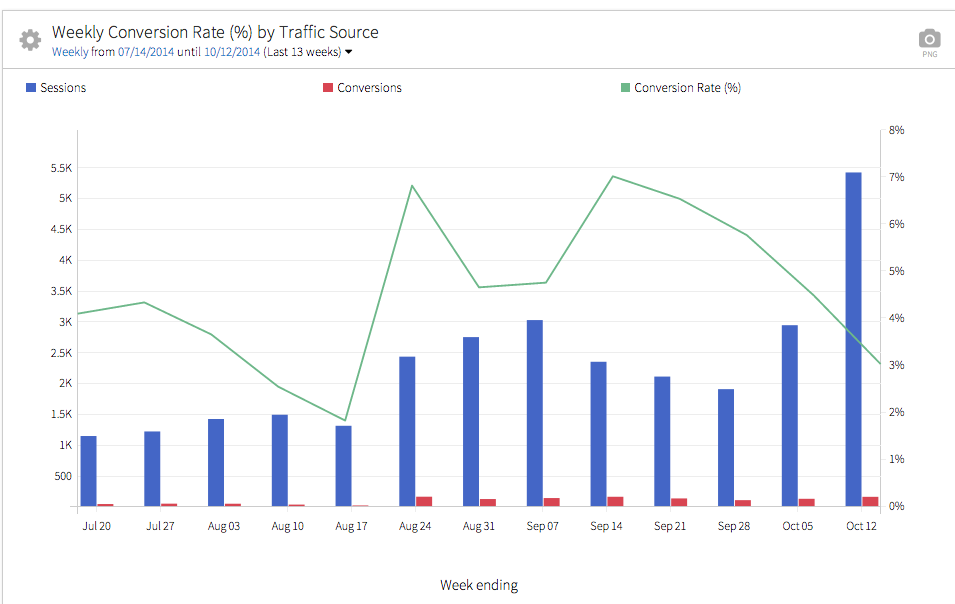
We’ve created a segment in Google Analytics that shows just trial account users. We can then apply this segment to show conversion to sales.

Conclusion
Whether your salespeople market primarily to consumers or businesses, you should tailor your reports to their unique, revenue-focussed, business goals. Focus on the metrics that matter to salespeople, such as tying specific online channels to revenue. In addition, show how channels contributed to various stages of the marketing funnel. Keep reports focused around showing the return from investments made in the website.

